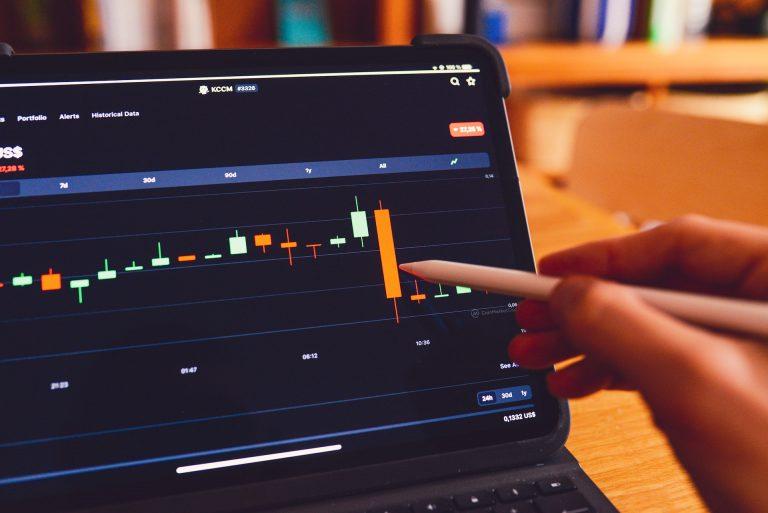
Top Stock Scanners for Identifying Volume Spikes

Stocks screener tools and stock scanners play a crucial role in helping traders identify volume spikes that signal potential breakouts or trend reversals. Volume spikes occur when a stock’s trading volume significantly exceeds its average volume, often indicating increased interest from institutional investors or news-driven movements.
Using a calculator for CAGR (Compound Annual Growth Rate) alongside stock scanners can help traders assess whether a stock with high volume spikes also has long-term growth potential. In this article, we’ll explore the best stock scanners for spotting volume spikes and how to use them effectively.
Why Volume Spikes Matter in Trading
Volume spikes indicate a sudden surge in buying or selling pressure, often leading to:
✔ Breakout Trading Opportunities – High volume confirms a strong move in price direction.
✔ Trend Reversals – Unusual volume can signal a shift in market sentiment.
✔ Institutional Activity – Large trading volumes suggest interest from hedge funds or big investors.
✔ News-Based Reactions – Earnings reports, mergers, or economic data can trigger spikes.
Best Stock Scanners for Volume Spikes
1. TradingView – Best for Customizable Volume Alerts
Features:
✔ Real-time scanning with volume filters
✔ Customizable alerts for unusual volume spikes
✔ Advanced technical indicators for confirmation
2. Trade Ideas – AI-Powered Stock Scanner
Features:
✔ AI-driven scans for high-volume breakouts
✔ Pre-market and real-time volume monitoring
✔ Custom filters for volume and volatility
3. Finviz Elite – Best for Heatmaps & Volume Scanning
Features:
✔ Screener for top gainers with volume spikes
✔ Heatmaps to visualize sector-wise volume surges
✔ Custom filters for relative volume and news catalysts
4. Benzinga Pro – Best for News-Driven Volume Spikes
Features:
✔ Real-time volume surge alerts linked to news events
✔ Pre-market and after-hours volume monitoring
✔ Custom-built scanners for momentum trading
5. ThinkorSwim (TD Ameritrade) – Best for Advanced Traders
Features:
✔ Custom scripting for high-volume alerts
✔ Volume-weighted average price (VWAP) integration
✔ Pre-market and live volume tracking
How to Use a Stock Scanner for Volume Spikes
Step 1: Set Volume Filters
- Look for stocks trading at 2x-5x their average daily volume.
- Use relative volume (RVOL) greater than 2.0 to filter high-momentum stocks.
Step 2: Combine with Technical Indicators
- MACD & RSI – To confirm bullish or bearish trends.
- VWAP – Helps identify institutional buying/selling pressure.
- Moving Averages – Stocks crossing key MAs with high volume signal strength.
Step 3: Use a Calculator for CAGR for Long-Term Growth
While volume spikes indicate short-term movement, a calculator for CAGR helps evaluate if a stock has sustainable long-term growth.
Final Thoughts
Using a stock scanner for volume spikes helps traders spot high-potential stocks before major price movements. By leveraging a stocks screener with real-time alerts and a calculator for CAGR for fundamental analysis, traders can make informed decisions and capitalize on profitable market opportunities.


